

We are continually striving to provide you with the best tools to ace your procurement and material...
Reporting: StructShare Analytics - We are excited to share the StructShare Analytics reporting dashboard live in all customer accounts. Users have 6 different views available - Executive View, Project View, Pricing Analysis, Accounting View, Warehouse View, and Usage View, that will highlight information based on various personas that interact with the StructShare platform.

The dashboards will update daily and 'Admin' level permissions are needed for access. For more information on how to use and access the new 'Analytics', follow this link to our Support Article found on the StuctShare Help Center.
Jump to view:


Executive View - Account overview at the top that includes Active Projects (not including Warehouses), Total POs, Total Spend, Active Suppliers, Total Invoices. View can be filtered by 'Project', 'Supplier', 'Year' and/or 'Period'.
Projects Overview- Gives you quick access to a high-level overview based on filter selection. Pulls data from the 'Line Items' with insights based on filters applied.Spend Analysis- Committed cost analysis over time. Separate filter for 'Year' and 'Period'. Ability to multi-select 'Year' and 'Period' for comparison. Allows you track and compare commitment trends based on selected filters.
Spend by Supplier - Highlights the committed cost by Supplier according to the 'Supplier' filter applied above. Ability to further filter this section by 'Budget Category' allowing you to breakdown the material spend per Supplier.
Actual vs. Estimated Spend by Project - Shows the 'Committed Cost' vs. 'Estimated Cost' comparison based on the 'Project' filter selected. Pulling data from the 'Estimated Cost' column of the Project 'BoM'. Ability to further filter this section by 'Budget Category' allowing you to breakdown the material 'Committed Cost' vs. 'Estimated Cost' on a project by project basis. Can view 'Spend' or 'Quantity'.
Top Items- Shows top items by aggregated quantity ordered, spent, or number of orders based on selection and filters applied. This graph allows you to track your most frequently ordered materials so you can be ahead of your purchasing whether that includes ordering in bulk for better pricing or keeping on hand for future project use.
Spend by Category- Shows committed cost distribution by 'Budget Category' based on the selected 'Project', Supplier', 'Year' and/or 'Period' filter applied above. Ability to further filter this section by Project 'Phase'.
Spend by Cost Code- Shows committed cost distribution by 'Cost Code' based on the selected 'Project', Supplier', 'Year' and/or 'Period' filter applied above. Ability to further filter this section by Project 'Phase'.
Both sections allow you to quickly see how much of the selected 'Budget Category' or 'Cost Code' is part of your 'Project' and/or 'Supplier' spend by 'Phase'.
Project View - View can be filtered by 'Project' and 'Supplier'.
Projects Overview- Includes insights based on the 'Project' and/or 'Supplier filter above.- Total Spend- Committed Cost, based on filters
- Estimate Spend- Estimated Cost, based on filters
- Unique Items- Number of 'Unique Items' ordered, based on filters
- Invoices- based on filters
- POs- based on filters
- Insights- Top item ordered, Main expenses, % of budget used (when applicable)
Committed vs Billed Cost by Supplier- Highlights the 'Committed Cost' vs. 'Billed Cost' by Supplier based on the selected 'Project' filter above.Top Items- Shows top items by aggregated quantity ordered, spent, or number of orders based on selection and 'Project' and/or 'Supplier' filter applied. This graph allows you to track your most frequently ordered materials so you can be ahead of your purchasing whether that includes ordering in bulk for better pricing or keeping on hand for future project use.
Item Life Cycle- Project specific quantities based on 'Project' and/or 'Supplier' filter applied. List of items in the 'Item Name' dropdown will be based on selected filters. Additional Project 'Phase' filter can also be applied. This screen allows you to see how many times a specific item was Estimated, Ordered, Received, Returned and Billed for. Insights provided based on selected filters give you additional information of the percentage an item was ordered compared to what was originally estimated, percentage received vs. ordered, and total spend on the selected item.
Spend by Category- Shows committed cost distribution by 'Budget Category' based on the selected 'Project' and/or 'Supplier' filter applied. Ability to further filter this section by Project 'Phase'.
Spend by Cost Code- Shows committed cost distribution by 'Cost Code' based on the selected 'Project' and/or 'Supplier' filter applied. Ability to further filter this section by Project 'Phase'.
Spend by Phase- Shows committed cost distribution by Project 'Phase' based on the selected 'Project' and/or 'Supplier' filter applied. Ability to further filter this section by 'Budget Category' and/or 'Cost Code'. Hovering over a section of the graph will show the 'Phase' and 'Spend' (committed cost, dollar amount and percentage).
Pricing Analysis - Multi-select Year, Period, Project, Item, Category [Budget Category], Cost Code and Supplier.
Spending Overview- Highlights the 'Committed Cost' of item(s) based on filters applied at the top of the screen.Item Unit Price- Shows average unit cost (Unit Price on PO) analysis over time. Option to view by 'Price' or 'Price vs. QTY' and ability to filter by 'Unit'. You can hover over a single months data point for additional information showing the 'Average Unit Price', 'Quantity Ordered' and 'Last Related PO #'.
All Purchases- Showing last purchases from 'Line Items' based on applied filters. Section includes 'Item Name', 'QTY', ''Unit Price', 'Total Spend', 'Date' and 'PO Number'.
Accounting View - Data pulls from the ‘Invoices’ page. View can be filtered by 'Project' and 'Supplier'.
Invoice Life Cycle- *Invoices that are not parsed with Project/Supplier, are NOT included in this view. Please reach out to your Customer Success Manager if you have questions.Invoices by Status- Shows invoices by status over the selected Year/Period. Select a 'Year' and/or 'Period' in addition to the 'Project' and/or 'Supplier filter applied above. View the 'Total', 'Approved' or 'Recorded' invoices based on selected filters. Ability to view 'Deleted' invoice data.
Invoices Volume by Supplier- Shows the distribution of invoice volume by 'Supplier'. Based on 'Supplier' filter applied above.
Invoices Volume by Project- Shows the distribution of invoice volume by 'Project'. Based on 'Project' filter applied above.
Invoices Volume- This section shows invoice volume over a selected 'Year' and/or 'Period'. Additional 'Project' and/or 'Supplier' filters can be applied above. invoice 'Total Volume' includes the 'Total Amount' with 'Tax'. Totals are rounded on the graph and you can hover over a specific data point for exact numbers. This allows you to compare invoice volume over time for a selected 'Project' and/or 'Supplier'.
Warehouse View - This view includes data where the Warehouse is the Project, 'Ship To', and where the Warehouse is a Supplier, 'Ship From' via a toggle. Users can select a specific Warehouse to view and adjust the 'Year' and/or 'Period'.
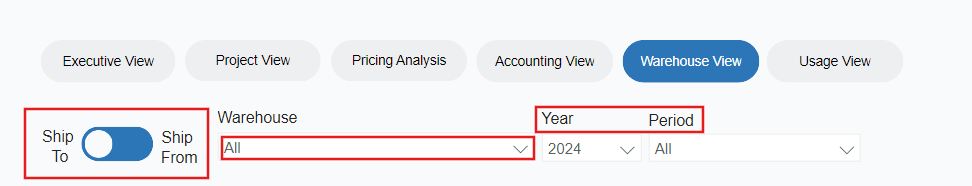
The 'Ship To' view includes the below sections:
The 'Ship From' view includes the below sections:Usage View - Shows the total usage data of StructShare's main features. Ability to filter usage on a Project by Project basis.
Company Usage- Highlights All Orders, # POs, # Rentals, # RFQs, # Requisitions, # Requisitions Fulfilled, Total Invoices, and # Approved Invoices based on Project filter above. Data can be viewed for the last 7 days, month to date, last 3 months, year to date, all data or by selecting 'Any' and applying a date range.
Usage Analysis- Usage analysis of Orders, Requisitions, RFQs and Approved Invoices. Ability to filter by 'Year' and 'Period' in addition to 'Project' filter above.
Top Usage- Shows the number of actions (Orders, Requtions, RFQs, Approved Invoices) by specific user name. Can filter by 'Year' and 'Period' in addition to 'Project' filter applied above. Includes an average,
Active Users- Shows the number of active users who created Orders, Requisitions, RFQs, or Approved Invoices over the selected 'Year' and 'Period' and based on the 'Project' filter applied above. Includes an average.
Support Article - If you are craving more information on how to use and access the new 'Analytics', follow this link to our Support Article found on the StuctShare Help Center. Additionally, you can reach out to support with any questions!